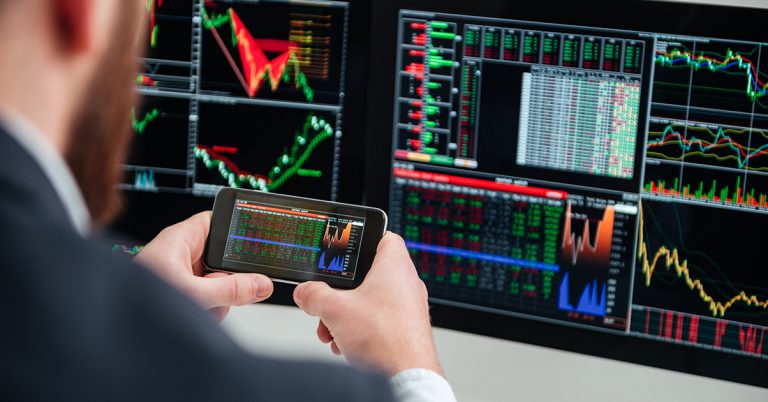
Unlike traditional stock markets, the crypto market has no official indices defined by a centralized entity. However, there are a number of crypto news platforms that offer a variety of crypto indices along with crypto market charts that give a brief idea about the recent market trends and behaviors. These charts are also similar to the traditional equity chats; candlestick, area graph, line charts, etc. are also the basic charts that traders and investors use for the crypto market.
So, what do these charts represent and what are the insights you can receive from them? Here are the details.
Crypto market charts are the visual representation of the performance of the particular digital coin that reflects a rate of change of price of the cryptocurrencies with respect to the time. Moreover, there are some advanced charts that also represents the volume accumulation in 24 hrs., highs and lows, market trend and the direction that the market heads towards. However, these advanced charts require sharp eyesight and a predictive mind that only comes with experience.
These kinds of charts may reveal details that not common eyes can see but for the professionals and analysts, they work like a charm. There are several types of crypto market charts and they are quite similar to the ones of the traditional equity market. Depending on how the information is displayed and the features such as price, volume, time intervals etc. these charts can be divided into four basic types namely line charts, candlestick charts, bar charts, and point & figure charts.
Line and candlestick type of crypto market charts are the most common and give brief and quick idea regarding the market movements. However, advanced traders and analysts go further on to the use of point and figure charts along with several indicators to predict the market movements.
Chart analysis is one of the basic skills that a crypto trader and investors should master. Charts normally reveal the patterns such as triangle, reverse triangle, head, and shoulder etc. which are used predict the upcoming movement of the market. More advanced patterns such as a bull flag, ascending triangle, butterfly, cup & handle, falling wedge, rectangle etc. are used for complex analysis during uptrend while head & shoulder, descending triangle, double top, rising wedge etc. are to analyze the downtrend.
These crypto market charts are one of the primary tools that crypto investors can use to get the most out of the market, and take advantage of cryptocurrencies in the virtual world or in the real world.
0 Comments